Debugging code can be difficult sometimes for newbies but it is not as difficult as it seems. In this post I will explain IntelliJ Debugging interface starting from the basics. I will not cover all the features. They are the ones that I use most.
Requirements
There is no requirements for this.
My Motivation
I used to debug my code with System.out.println(); and it was OK for me. I didn’t have any complaints about it because I thought using debugging interface does the same thing with a fancy label. Last year I did an internship and one day, I forgot to remove System.out.println(); in my pull request. It was rejected in the code review and my mentor taught me the basics of debugging. It was a good experience for me although I had difficulty giving up my bad habit. Now, I’ve completely quitted System.out.println(); and explored some much about debugging. It’s time to share what I’ve learnt.
1. Setting breakpoints
The most important part of debugging is breakpoints. Breakpoint is the place where you want to pause your program for debugging purposes. When your program pauses at somewhere, you can see many properties of your current scope. There are four types of breakpoints.
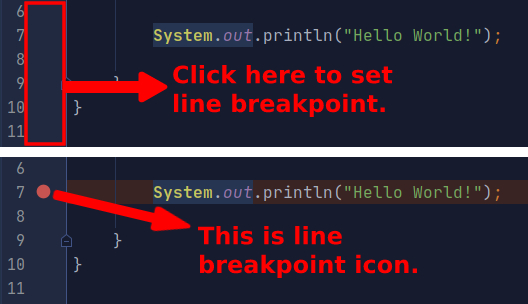
1.1 Line Breakpoint
This is the most used one of all. It pauses your program before the marked line is executed. Just click on the gutter near line number to set your breakpoint. There is only one requirement, the line should be executable.
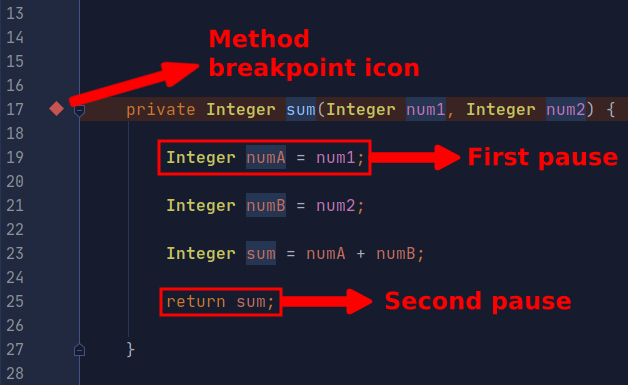
1.2 Method Breakpoint
You can pause the program to see the entering and exiting values of a method. This breakpoint pauses the program twice. Click the gutter where the method is declared. You can also click the class declaration to set breakpoint to the constructor.
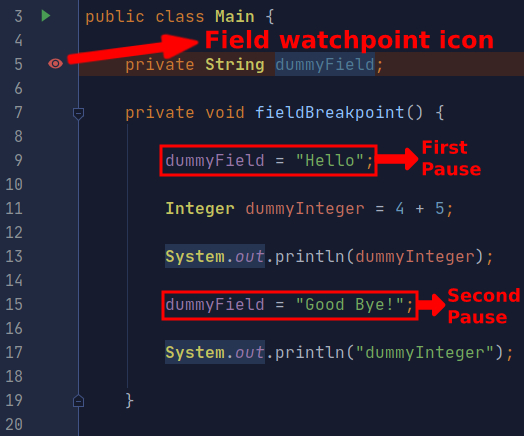
1.3. Field Watchpoint
This is used for tracking all interactions for a field. Set the breakpoint on the field declaration. Your program will pause every time you interact with that field.
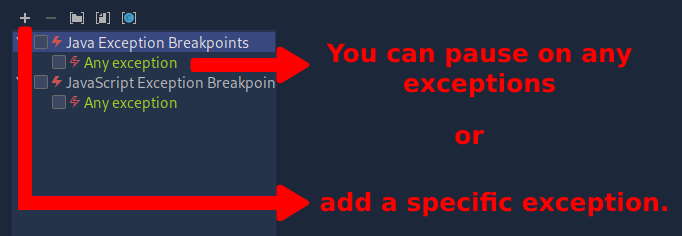
1.4. Exception Breakpoint
When you set an exception breakpoint, your program pauses whenever an exception is thrown. It’s global and not dependent on your source code. So, you don’t set it with gutter clicks like previous ones. Open View Breakpoints window with Ctrl+Shift+F8 or View Breakpoints button in Debug window. You can choose Any Exception under Java Exception Breakpoints or add a specific exception with the + icon or Alt+Insert.
You can add all types of breakpoints in this window. But gutters are more convenient for others.
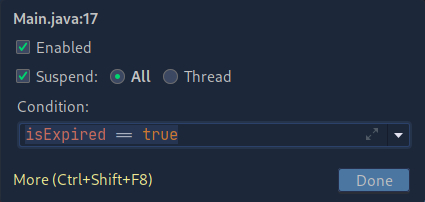
1.5 Conditional Breakpoint
No need to explain, it does what the name says. After setting a breakpoint right click on the icon you will see basic condition input.
You can write a condition as if you are writing an if condition. It will pause if the condition returns true.
IntelliJ provides different types of conditions and filters but I will not explain them. See IntelliJ docs.
2. Debug Window
2.1 Step Functions
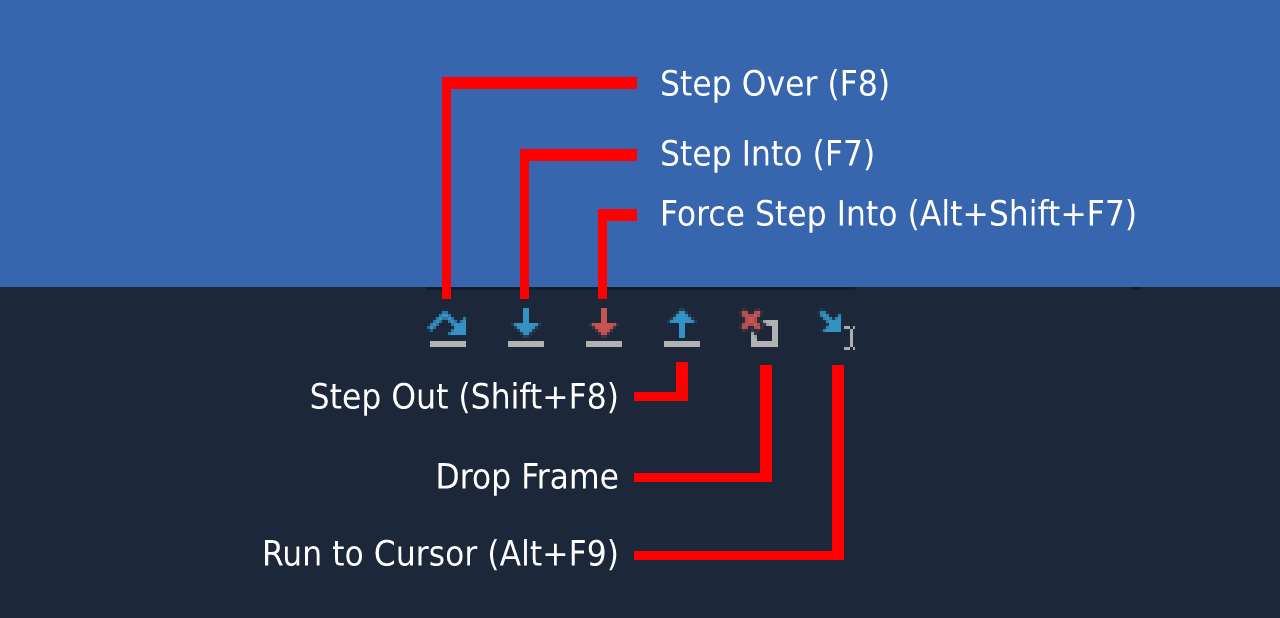
You can see the step functions above. These buttons are taken from Debug window. You can use Alt+5 to open Debug window if not visible. Let’s dive into the details of these step functions.
Step Over: When you step over a line, you execute it and pause before the next line is executed.
Step Into: If you step into a line, there are two possibilities. If there is a function call debugger go to that function and execute it step-by-step. Otherwise, it will behave like Step Over since there’s nothing to step into.
Force Step Into: In some cases debugger ignores the step into option and behaves like step over. You can force it to step into with it. For instance, debugger ignores stepping into `String string = new String(“Hello World!");` but if you force, you will see String implementation.
Step Out: You go back where you called the current function. To continue with the example above, when you click Step Out inside String implementation then you go back where you call new String();.
Drop Frame: It’s going one step backward. As I stated before in this article, when your program pauses at some point, you see the current stack frame. You go to previous stack frame with it. But do not confuse, you don’t go back in time, you just go one step backward. It won’t undo your last operation.
Run to Cursor: It will take the debugger where your cursor is regardless of the breakpoints.
2.2 Debugger Control Buttons
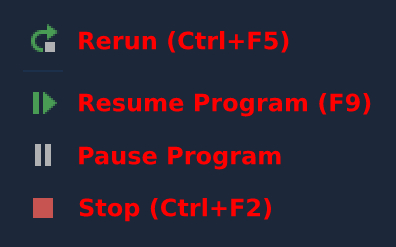
These are debugger control buttons placed leftmost part of the debugger window.
Rerun: It does what it says.
Resume Program: It resumes the program from where it is paused until a breakpoint pauses it again.
Pause Program: It pauses the running program but does not provide you all the functionalities that breakpoints have.
Stop: It stops the running program as you might guess.
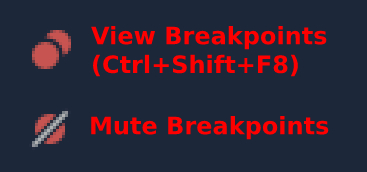
View Breakpoints: It will show a window where you can see all set breakpoints, set/remove breakpoints and define conditions.
Mute Breakpoints: It will deactivate all set breakpoints.
2.3 Tracing Variables
You write a method or any piece of code and expect it to work as you planned but things don’t go well. If you trust your algorithm, the best option is to trace every change in your code through the stack frame. Just set a breakpoint and see every change.
Think of a method that you give a ticket date in String as parameter and it returns you whether the ticket is expired. You think something is wrong according and wanted to debug your method step by step. You might have parsed the String date wrong or made a mistake while calculating the days between two dates. Just put breakpoints in your method and inspect changes in variables. I created a simple dummy method and set the breakpoint at the end of the method to see all variables' last state.
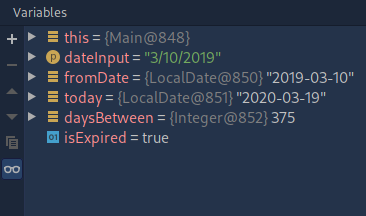
You see dateInput variable and it is parsed as “2019-03-10”. Then you check front-end and see that the date is actually sent as “dd-M-yyyy” but parsed like “M/dd/yyyy”. So the problem is solved quickly. This is a dummy example to see the basic purpose of tracing variables.
Real-life scenarios will be more useful.
2.4 Evaluating Expressions and Setting Values Manually
These are also good features. You can test your paused application with different values and take your inspection further. If you look at a variable and say “what would happen if it were …?", this means you need one of these features. Evaluate Expression also provides more than just setting values.
To set a value basically, right-click on the variable, select Set Value (F2) and write the new value.
If you want to have more advanced capabilities or evaluate a Java expression, right-click on the variable and select Evaluate Expression (Alt+F8). You can run your expression in that window.
Think of the last dummy example above in 2.3 Tracing Variables. You wanted to see if your method would work correctly when you change your parser. Change the date before logic and see what happens.
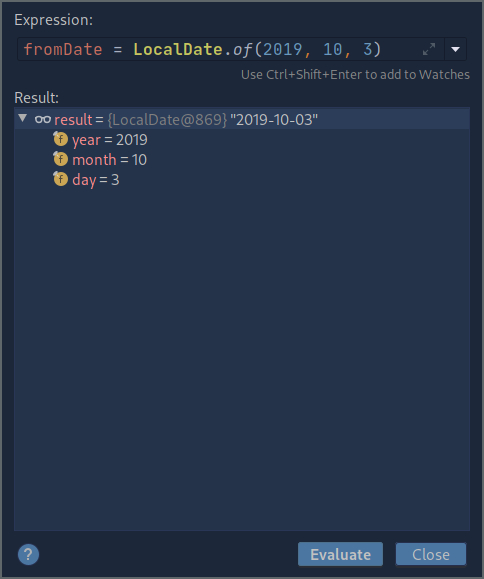
You can also declare a new variable and add it to your watches. Result is shown under the expression input as you see.
My main resource is IntelliJ docs. You can check this link for further information.